Risk Management in the Construction Industry
Explore risk management in construction with a blog post covering key topics: Workshops for collaboration, Identification and Register of risks, creating a Management Plan, Mitigation strategies, QS interaction with risk, Risk Analysis, assessing Probability and Impact, calculating Expected Monetary Value (EMV), using Monte Carlo Simulation, understanding Central Limit Theory (CLT), applying Route Mean Square (RMS), and setting Quantified Risk Allowances.
AREAS OF COMPETENCE - OPTIONAL
Mohamed Ashour
1/29/202416 min read


Risk Management in the Construction Industry – A guide for RICS APC candidates
Overview
Risk management is the process of identifying, analysing, and responding to the uncertainties and potential threats that may affect the objectives, performance, and outcomes of a project. Risk management is essential for the construction industry, as it involves complex, dynamic, and unpredictable environments, where multiple stakeholders, resources, and variables interact and influence each other.
Risk management is also am optional competency for the RICS APC, which requires candidates to demonstrate their knowledge and skills in applying risk management principles and methods to construction projects, as well as their awareness of the relevant RICS guidance notes and the UK laws and regulations.
In this blogpost, we will discuss some of the key aspects of risk management in the construction industry and provide some real-life examples and references to help you prepare for your RICS APC.
The key points that are going to be highlighted in this blog post are:
Workshops
Identification
Register
Management plan
Mitigation
QS contribution to risk management
Risk analysis
Probability and impact
Expected Monetary Value – EMV
Monte Carlo Simulation
Central Limit Theory – CLT
Route Mean Square – RMS
Quantified risk allowances
Workshops
A risk workshop is a collaborative and structured method of identifying and analysing the risks that may affect a project. It involves the participation of key stakeholders, such as the client, the project manager, the design team, the contractors, and the consultants. The purpose of a risk workshop is to create a shared understanding of the project scope, objectives, and constraints, and to identify the sources, causes, and effects of potential risks. A risk workshop can be conducted at any stage of the project lifecycle, but it is especially useful at the initiation and planning phases, when the project scope and objectives are defined, and the project team is formed.
A typical risk workshop consists of the following steps:
Establishing the workshop objectives, agenda, and ground rules.
Reviewing the project scope, objectives, and constraints.
Brainstorming the potential risks using various techniques, such as SWOT analysis, PESTLE analysis, or risk breakdown structure.
Prioritising the risks using a risk matrix or a risk ranking method.
Assigning risk owners and actions for each risk.
Documenting the workshop outcomes and recommendations.
An example of a risk workshop in the construction industry is the one conducted by the Crossrail project team in 2009, which involved more than 200 participants from different organisations and disciplines. The workshop identified over 1,000 risks, which were then grouped into 12 categories, such as design, procurement, interfaces, and stakeholder management. The workshop also established a risk management plan, which defined the roles and responsibilities, the risk management process, and the risk reporting and monitoring mechanisms for the project [1].
Identification
Risk identification is the process of finding and describing the potential risks that may affect a project. It is a continuous and iterative process, as new risks may emerge or change throughout the project lifecycle. Risk identification can be done using various sources of information, such as historical data, lessons learned, expert opinions, industry standards, and stakeholder feedback. Risk identification can also be done using various tools and techniques, such as checklists, interviews, surveys, brainstorming, Delphi method, cause and effect diagrams, and scenario analysis.
Risk identification should result in a clear and concise description of each risk, which should include the following elements:
The risk event, which is the uncertain occurrence that may affect the project.
The risk cause, which is the source or reason of the risk event.
The risk effect, which is the impact or consequence of the risk event on the project objectives.
An example of a risk identification in the construction industry is the one done by the London 2012 Olympic Delivery Authority (ODA), which identified over 2,000 risks for the delivery of the Olympic Park and the venues. The ODA used a risk register, which is a document that records and tracks the risks, their causes, effects, probabilities, impacts, owners, and responses. The ODA also used a risk map, which is a graphical representation of the risks, their interrelationships, and their relative importance. The ODA updated and reviewed the risk register and the risk map regularly, and communicated them to the relevant stakeholders [2].
Register
A risk register is a document that records and tracks the risks, their causes, effects, probabilities, impacts, owners, and responses. It is a key tool for risk management, as it helps to document, analyse, prioritise, monitor, and control the risks that may affect a project. A risk register can be created using various formats, such as spreadsheets, databases, or software applications. A risk register can also be structured using various levels of detail, such as summary, detailed, or hierarchical.
A risk register should include the following information for each risk:
A unique identifier, such as a number or a code.
A brief description, which summarises the risk event, cause, and effect.
A category, which classifies the risk according to its source, type, or nature.
A probability, which estimates the likelihood of the risk event occurring.
An impact, which estimates the severity of the risk effect on the project objectives.
A priority, which ranks the risk according to its importance or urgency.
An owner, which assigns the responsibility for managing the risk to a person or a group.
A response, which defines the strategy and the actions for dealing with the risk.
A status, which indicates the current state or progress of the risk management.
A date, which records the last update or review of the risk information.
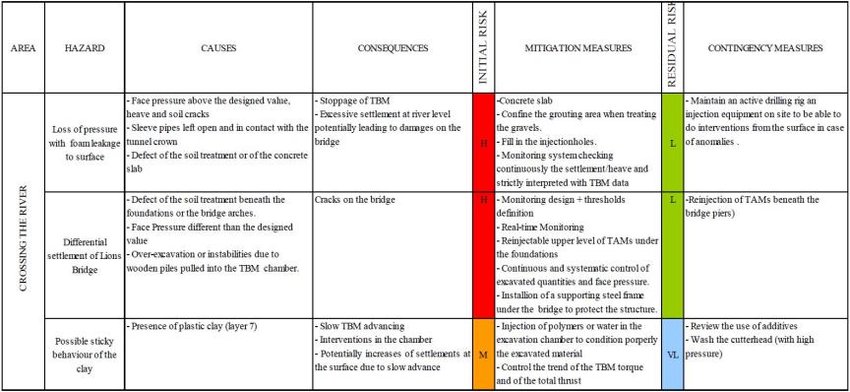
An example of a risk register in the construction industry is the one used by the Heathrow Terminal 5 project, which involved the construction of a new terminal, two satellite buildings, a rail station, and a car park. The project used a risk register, which contained over 10,000 risks, which were categorised into 12 groups, such as design, construction, commissioning, and operations. The project also used a risk management system, which integrated the risk register with the project schedule, cost, and quality data. The project updated and reviewed the risk register regularly, and used it to support the decision making and the reporting processes [3].
You can find below a sample risk register
Management plan
A risk management plan is a document that describes how the risk management process will be conducted, organised, and implemented for a project. It is a component of the project management plan, which defines the overall approach and methodology for managing the project. A risk management plan should include the following information:
The objectives and scope of the risk management process, which specify what the process aims to achieve and what aspects of the project it covers.
The roles and responsibilities of the risk management team, which define who will be involved in the process and what their duties and authorities are.
The risk management process, which describes the steps and the activities for identifying, analysing, prioritising, responding, and monitoring the risks.
The risk management tools and techniques, which specify what methods and resources will be used to support the process.
The risk management documentation and communication, which define what documents and reports will be produced and how they will be distributed and shared among the stakeholders.
The risk management review and audit, which describe how the process will be evaluated and improved throughout the project lifecycle.
An example of a risk management plan in the construction industry is the one developed by the Channel Tunnel Rail Link (CTRL) project, which involved the construction of a high-speed railway line between London and the Channel Tunnel. The project developed a risk management plan, which defined the objectives, scope, roles, responsibilities, process, tools, techniques, documentation, communication, review, and audit of the risk management for the project. The project also established a risk management organisation, which consisted of a risk management board, a risk management team, and a risk management network. The project followed and updated the risk management plan throughout the project lifecycle, and used it to ensure the effective and consistent management of the risks [4].
Mitigation
Risk mitigation is the process of reducing the probability and/or the impact of the risks that may affect a project. It is one of the possible strategies for responding to the risks, along with risk avoidance, risk transfer, and risk acceptance. Risk mitigation can be done using various techniques, such as design changes, contingency plans, alternative solutions, quality assurance, testing, training, and insurance. Risk mitigation should be aligned with the project objectives, scope, budget, and schedule, and should be proportionate to the priority and the severity of the risks.
An example of risk mitigation in the construction industry is the one implemented by the London Eye project, which involved the construction and installation of a giant observation wheel on the banks of the River Thames. The project faced several risks, such as technical, environmental, legal, and operational risks. The project implemented various risk mitigation measures, such as:
Designing the wheel to withstand high winds, earthquakes, and lightning strikes.
Installing a backup generator and a backup hydraulic system to ensure the continuity of the operation in case of power failure or mechanical failure.
Obtaining the necessary planning permissions, consents, and licences from the authorities and the stakeholders.
Conducting extensive testing and inspection of the wheel components and the capsules before and after the installation.
Providing training and guidance to the staff and the visitors on the safety and the emergency procedures.
Purchasing insurance policies to cover the potential losses and liabilities arising from the project.
By implementing these risk mitigation measures, the project was able to reduce the probability and the impact of the risks, and to deliver the project successfully and safely [5].
QS Contribution to Risk Management
As a quantity surveyor, you have a significant role and responsibility in contributing to risk management in construction projects. You can help to identify, assess, and mitigate the risks that may affect the cost, time, quality, and sustainability of the project, as well as the interests and expectations of the client and other stakeholders. Some of the ways that you can contribute to risk management are:
Conducting feasibility studies and cost-benefit analyses to evaluate the viability and profitability of the project, and to identify the potential risks and opportunities.
Preparing and managing the project budget and cash flow, and ensuring that adequate contingencies and allowances are included to cover the identified risks and uncertainties.
Providing cost advice and estimates at different stages of the project, and updating them regularly to reflect the changes and variations that may occur due to the risks and uncertainties.
Advising on the appropriate procurement and contract strategies and methods, and ensuring that the contract documents include clear and fair clauses and conditions for risk allocation and management.
Monitoring and controlling the project costs and variations, and reporting any deviations or issues that may arise due to the risks and uncertainties.
Participating in risk workshops and meetings with the client and other project team members, and providing input and feedback on the risk identification, analysis, and response plans.
Using risk management tools and techniques, such as risk registers, risk matrices, risk breakdown structures, and risk response strategies, to document and communicate the risks and their impacts and actions.
As a QS, you should be familiar with the RICS guidance notes on risk management, such as the RICS Risk Management Guidance Note 2nd Edition (2014), the RICS Risk, Liability and Insurance in Valuation Work Guidance Note 2nd Edition (2017), and the RICS Risk Management and Procurement Guidance Note 1st Edition (2019). You should also be aware of the UK laws and regulations that relate to risk management in construction, such as the Construction (Design and Management) Regulations 2015, the Contracts (Rights of Third Parties) Act 1999, and the Unfair Contract Terms Act 1977 [6], [7], [8], [9], [10], [11].
Risk Analysis
Risk analysis is the process of estimating the likelihood and the impact of the identified risks on the project objectives and outcomes. Risk analysis can be qualitative or quantitative, depending on the level of detail and accuracy required, and the availability of data and information. Qualitative risk analysis involves using descriptive scales and ratings, such as high, medium, and low, or very likely, likely, and unlikely, to assess the probability and the impact of the risks. Quantitative risk analysis involves using numerical values and calculations, such as percentages, probabilities, and expected values, to measure the probability and the impact of the risks.
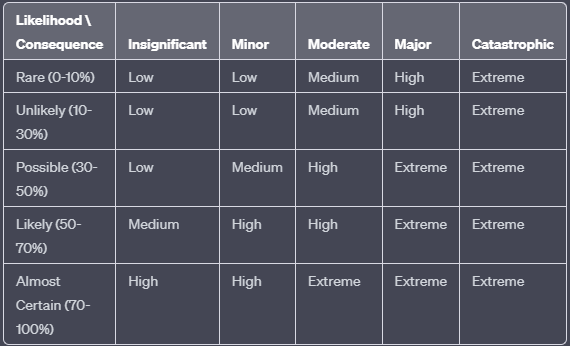
One of the common tools for risk analysis is the risk matrix, which is a table that shows the relationship between the probability and the impact of the risks, and assigns a risk level or score to each risk, based on a predefined criteria or threshold. The risk matrix can help to prioritise the risks and to determine the appropriate risk response strategies. For example, a risk matrix may look like this:
A real-life example of using a risk matrix for risk analysis is the case of the London 2012 Olympic Park project, which involved the construction of a large-scale sports and leisure complex for the Olympic and Paralympic Games. The project team used a risk matrix to assess the probability and the impact of the various risks that could affect the project, such as design changes, delays, cost overruns, safety incidents, environmental issues, and stakeholder disputes. The risk matrix helped the project team to identify the most critical risks and to allocate the resources and efforts accordingly. The project was successfully delivered on time and within budget, and achieved a high level of quality and sustainability [12] ,[14].
Probability and Impact
Probability and impact are two key parameters that are used to quantify the risks and their effects on the project. Probability is the measure of the likelihood or the chance of a risk occurring, and it can be expressed as a percentage, a fraction, a decimal, or a ratio. Impact is the measure of the consequence or the effect of a risk on the project objectives and outcomes, and it can be expressed as a monetary value, a time duration, a quality level, or a performance indicator.
One of the methods for estimating the probability and the impact of the risks is the Expected Monetary Value (EMV) analysis, which is the product of the probability and the impact of a risk. EMV analysis can help to compare the costs and benefits of different risk response options, and to determine the optimal risk response strategy. For example, if a risk has a probability of 0.2 (20%) and an impact of £100,000, the EMV of the risk is £20,000 (0.2 x 100,000). If a risk response option has a cost of £15,000 and can reduce the probability of the risk to 0.1 (10%), the EMV of the risk after the response is £10,000 (0.1 x 100,000). The net benefit of the risk response option is £5,000 (20,000 - 15,000 - 10,000).
A real-life example of using EMV analysis for estimating the probability and the impact of the risks is the case of the Channel Tunnel project, which involved the construction of a 50-km rail tunnel under the English Channel, connecting the UK and France. The project team used EMV analysis to evaluate the risks and the uncertainties that could affect the project cost and schedule, such as geological conditions, technical issues, contractual disputes, and regulatory changes. The EMV analysis helped the project team to estimate the contingency and the risk allowances for the project, and to plan and implement the risk response actions. The project was completed in 1994, after 15 years of construction, and cost £9.5 billion, which was 80% more than the original estimate [12], [14].
Monte Carlo Simulation
Monte Carlo simulation is a statistical technique that uses random sampling and probability distributions to model the uncertainty and variability of the risks and their impacts on the project. Monte Carlo simulation can help to estimate the range and the likelihood of the possible outcomes of the project, such as the total cost, the completion time, the quality level, and the performance indicator. Monte Carlo simulation can also help to identify the critical risks and the sensitive variables that have the most influence on the project outcomes.
One of the tools for performing Monte Carlo simulation is the @RISK software, which is an add-in for Microsoft Excel that allows the user to define the probability distributions and the correlations of the risks and their impacts, and to generate the simulation results and the reports. @RISK software can help to create the histograms, the cumulative curves, the tornado charts, and the scatter plots that show the distribution and the probability of the project outcomes, and the sensitivity and the contribution of the risks and the variables.
A real-life example of using Monte Carlo simulation for modelling the uncertainty and variability of the risks and their impacts is the case of the Burj Khalifa project, which involved the construction of the world's tallest building in Dubai, UAE. The project team used Monte Carlo simulation to estimate the cost and schedule risk of the project, and to analyse the effects of the various risks and uncertainties, such as design changes, material availability, labour productivity, weather conditions, and market fluctuations. The Monte Carlo simulation helped the project team to determine the contingency and the risk allowances for the project, and to monitor and control the project cost and schedule. The project was completed in 2010, after six years of construction, and cost $1.5 billion, which was within the budget [13].
Central Limit Theory – CLT
Central Limit Theory (CLT) is a mathematical theorem that states that the sum or the average of a large number of independent and identically distributed random variables tends to follow a normal distribution, regardless of the shape of the original distribution. CLT is important for risk management, as it allows the use of the normal distribution and its properties, such as the mean, the standard deviation, and the confidence intervals, to estimate the probability and the impact of the risks and their effects on the project outcomes.
One of the applications of CLT for risk management is the Route Mean Square (RMS) method, which is a technique that uses the square root of the sum of the squares of the individual risks and their impacts to calculate the overall risk and its impact on the project. RMS method can help to account for the correlation and the interaction of the risks and their impacts, and to provide a more accurate and realistic estimate of the project outcomes. For example, if a project has three risks, A, B, and C, with the impacts of 10, 20, and 30 units respectively, the RMS of the overall risk and its impact is 37.4 units (squareroot(10^2 + 20^2 + 30^2)).
A real-life example of using CLT and RMS method for estimating the probability and the impact of the risks and their effects on the project outcomes is the case of the Thames Tideway Tunnel project, which involved the construction of a 25-km sewer tunnel under the River Thames in London, UK. The project team used CLT and RMS method to assess the cost and schedule risk of the project, and to consider the effects of the various risks and uncertainties, such as geotechnical conditions, environmental issues, stakeholder engagement, and regulatory changes. The CLT and RMS method helped the project team to estimate the contingency and the risk allowances for the project, and to plan and implement the risk response actions. The project is expected to be completed in 2024, after nine years of construction, and cost £4.2 billion, which is within the budget [14], [15].
Quantified Risk Allowances
Quantified risk allowances are the amounts of money or time that are added to the project budget or schedule to cover the identified risks and uncertainties that may affect the project outcomes. Quantified risk allowances are based on the results of the risk analysis and the risk response plans, and they reflect the level of confidence and the degree of accuracy of the project estimates. Quantified risk allowances can help to reduce the likelihood and the impact of the cost and schedule overruns, and to increase the probability of the project success.
One of the methods for calculating the quantified risk allowances is the PERT (Program Evaluation and Review Technique) method, which is a technique that uses the optimistic, the most likely, and the pessimistic estimates of the project activities and their durations to calculate the expected duration and the standard deviation of the project. PERT method can help to account for the uncertainty and variability of the project schedule, and to provide a range and a probability of the project completion time. For example, if a project activity has an optimistic estimate of 10 days, a most likely estimate of 15 days, and a pessimistic estimate of 20 days, the expected duration of the activity is 15 days ((10 + 4 x 15 + 20) / 6), and the standard deviation of the activity is 1.67 days ((20 - 10) / 6).
A real-life example of using PERT method for calculating the quantified risk allowances is the case of the Sydney Opera House project, which involved the construction of a iconic cultural and architectural landmark in Sydney, Australia. The project team used PERT method to estimate the schedule risk of the project, and to consider the effects of the various risks and uncertainties, such as design changes, technical challenges, labour disputes, and political interference. The PERT method helped the project team to calculate the contingency and the risk allowances for the project, and to monitor and control the project schedule. The project was completed in 1973, after 14 years of construction, and cost $102 million, which was 14 times more than the original estimate [14], [15].
Conclusion
Risk management is a vital skill and knowledge area for the construction industry and the RICS APC. In this blogpost, we have discussed some of the key aspects of risk management in the construction industry, such as the QS contribution to risk management, the risk analysis, the probability and the impact, the Monte Carlo simulation, the Central Limit Theory, the Route Mean Square, and the quantified risk allowances. We have also provided some real-life examples and references to help you understand and apply the risk management principles and methods to your own projects and to demonstrate your competence for the RICS APC.
We hope that you have found this blogpost useful and informative, and that it has given you some insights and tips on how to manage the risks and the uncertainties in the construction industry. If you have any questions or comments, please feel free to contact us or leave a comment below. We would love to hear from you and to help you with your RICS APC preparation and success.
References
Crossrail. (2010). Risk Management Case Study – Crossrail. Retrieved from https://learninglegacy.crossrail.co.uk/documents/risk-management-case-study-crossrail/
Olympic Delivery Authority. (2011). Learning Legacy: Lessons Learned from the London 2012 Games Construction Project. Retrieved from https://webarchive.nationalarchives.gov.uk/20180405123319/http://learninglegacy.independent.gov.uk/documents/pdfs/risk-management/risk-management.pdf
Davies, A., Gann, D., & Douglas, T. (2009). Innovation in Megaprojects: Systems Integration at London Heathrow Terminal 5. California Management Review, 51(2), 101-125. Retrieved from https://journals.sagepub.com/doi/10.2307/41166465
Chapman, C., & Ward, S. (2003). Project Risk Management: Processes, Techniques and Insights. Chichester: John Wiley & Sons.
Morris, P. W. G., & Hough, G. H. (1987). The Anatomy of Major Projects: A Study of the Reality of Project Management. Chichester: John Wiley & Sons.
RICS (2014). Risk Management Guidance Note 2nd Edition. RICS, London.
RICS (2017). Risk, Liability and Insurance in Valuation Work Guidance Note 2nd Edition. RICS, London.
RICS (2019). Risk Management and Procurement Guidance Note 1st Edition. RICS, London.
Construction (Design and Management) Regulations 2015. SI 2015/51. The Stationery Office, London.
Contracts (Rights of Third Parties) Act 1999. Chapter 31. The Stationery Office, London.
Unfair Contract Terms Act 1977. Chapter 50. The Stationery Office, London.
Flyvbjerg, B., Bruzelius, N., and Rothengatter, W. (2003). Megaprojects and Risk: An Anatomy of Ambition. Cambridge University Press, Cambridge.
Palisade Corporation (2020). @RISK: Risk Analysis using Monte Carlo Simulation in Excel and Project. https://www.palisade.com/risk/
PMI (2017). A Guide to the Project Management Body of Knowledge (PMBOK Guide) 6th Edition. Project Management Institute, Newtown Square.
Zwikael, O. and Smyrk, J. (2019). Project Management: A Benefit Realisation Approach. 3rd Edition. Palgrave, Cham.